Interactive guideline decision models & dashboards
In last week’s post, I proposed that guideline creation panels start including decision models and dashboards in their guideline summaries and recommendations. I included an example decision model and dashboard to illustrate how this process could work. The dashboard I included has a couple of shortcomings. It is not interactive and does not show how uncertainties can be included in a dashboard display. The purpose of today’s post is to demonstrate the basic elements of an interactive decision dashboard.
Today’s technology makes it easy to build and disseminate complex, interactive dashboards and other information visualizations of all types. One of the best resources to learn about these capabilities is Tableau Public. Users of this site can explore information visualizations about many topics and learn how to create and post their own. Use of the Tableau Public site is free but all visualizations are open to public access. Licenses for the Tableau software can be purchased for proprietary use.
I used the Tableau Public site to create a simple interactive dashboard regarding the following decision:
Imagine you have a newly diagnosed chronic disease that is causing symptoms severe enough to limit your daily activities. Fortunately, several treatment options are available. Information about how well they work, their risk of side effects, and monthly out-of-pocket cost is summarized in the table below:
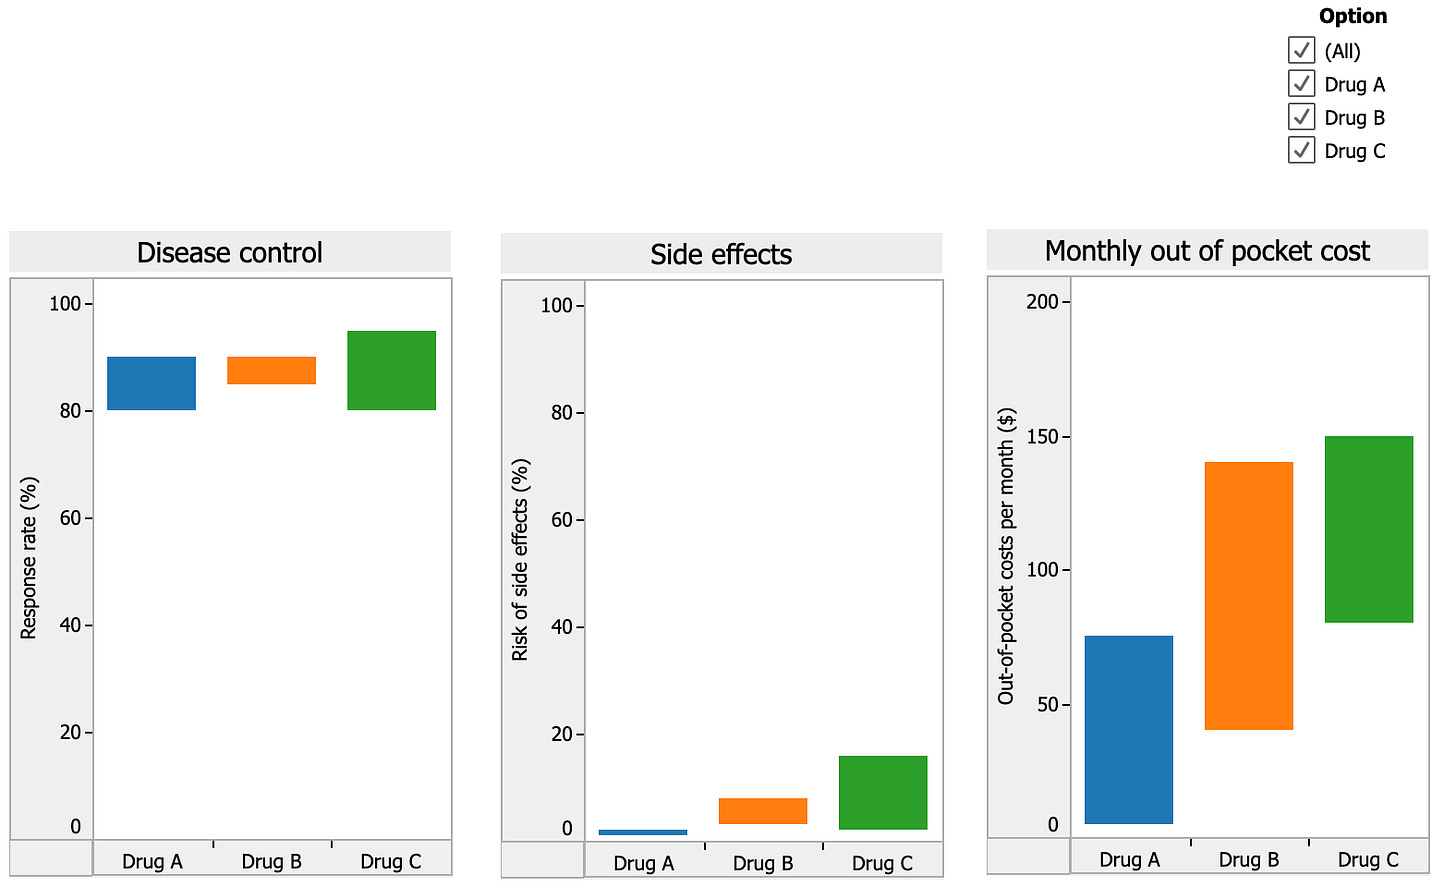
The goal of a decision dashboard is to help you compare the three drugs and choose the one that you would pick to treat your symptoms. A dashboard using the information in the table that compares the 3 drugs is shown below. Note, if you want to choose which drugs to display, use the checkboxes on the upper right.
A screenshot of the dashboard is shown below. Click this link to access the working version.
The initial display compares how the three drugs compare over three different dimensions: disease control or effectiveness, risk of side effects, and out of pocket cost. The range of possible values are graphically illustrated in the different colored bars.
Some may find the default display sufficient to choose a preferred drug. For example, someone may not be able to afford more than $100 per month, which would eliminate Drug C and probably Drug B as well. They can quickly see, however, that Drug A is the safest drug and should be as nearly if not as effective as the other two, making it a good choice.
Others may choose to make a decision by first eliminating a less desirable drug and then reviewing how the remaining two match up. For example, someone might choose to eliminate Drug C due to its high cost and high risk of side effects compared to the other two drugs. They then uncheck the box next to Drug C on the interactive dashboard and concentrate on comparing the two remaining drugs across the three decision criteria as illustrated below:
Musings
Clinical guidelines summarize and evaluate existing data to recommend how it should be applied in clinical practice. Most guidelines as currently written summarize the research findings and list practice recommendations in great detail, sometimes across the span of two or three separate articles. This format does a good job of documenting the data supporting the recommendations but is not designed to make either the data or the recommendations readily usable to support decision making in clinical practice. A simple solution to this problem is to create a decision-ready summary of the guideline data and recommendations in the form of a decision model and interactive decision dashboard.
In addition to making the guideline information more readily usable, a recommendation-based decision model could also be used to collect the perspectives and judgments of diverse clinical decision makers. The model could be disseminated as a small, interactive file with questions regarding decision related trade offs and judgments, and a mechanism for modifying the basic model supplied by the guideline panel. Models adapted through clinical use could be saved and anonymously aggregated to provide important information that could be used to inform future iterations of the practice guidelines.


